OSNR, BER, Q-factor: How Optical Engineers Measure Link Quality Interview Prep
OSNR, BER, and Q-factor in optical engineering — pre-FEC vs post-FEC BER, FEC limit, OSNR margin, shot vs thermal noise, and how operators measure link health.
Quick answer
Optical link-quality metrics are the operational language of optical transport.
Optical link-quality metrics are the most-asked operational topic in optical-engineering interviews because they are the daily language of the deployed network.
Editorial review
Written by
CompoundLearn editorial team
Wireless / RF / hardware engineering
Reviewed by
CompoundLearn editorial team
Wireless / RF / hardware engineering
Last reviewed
Built from curated topic maps, editorial validation, and subject-matter review so the page stays aligned with the interview intent and the current content pipeline.
What it is
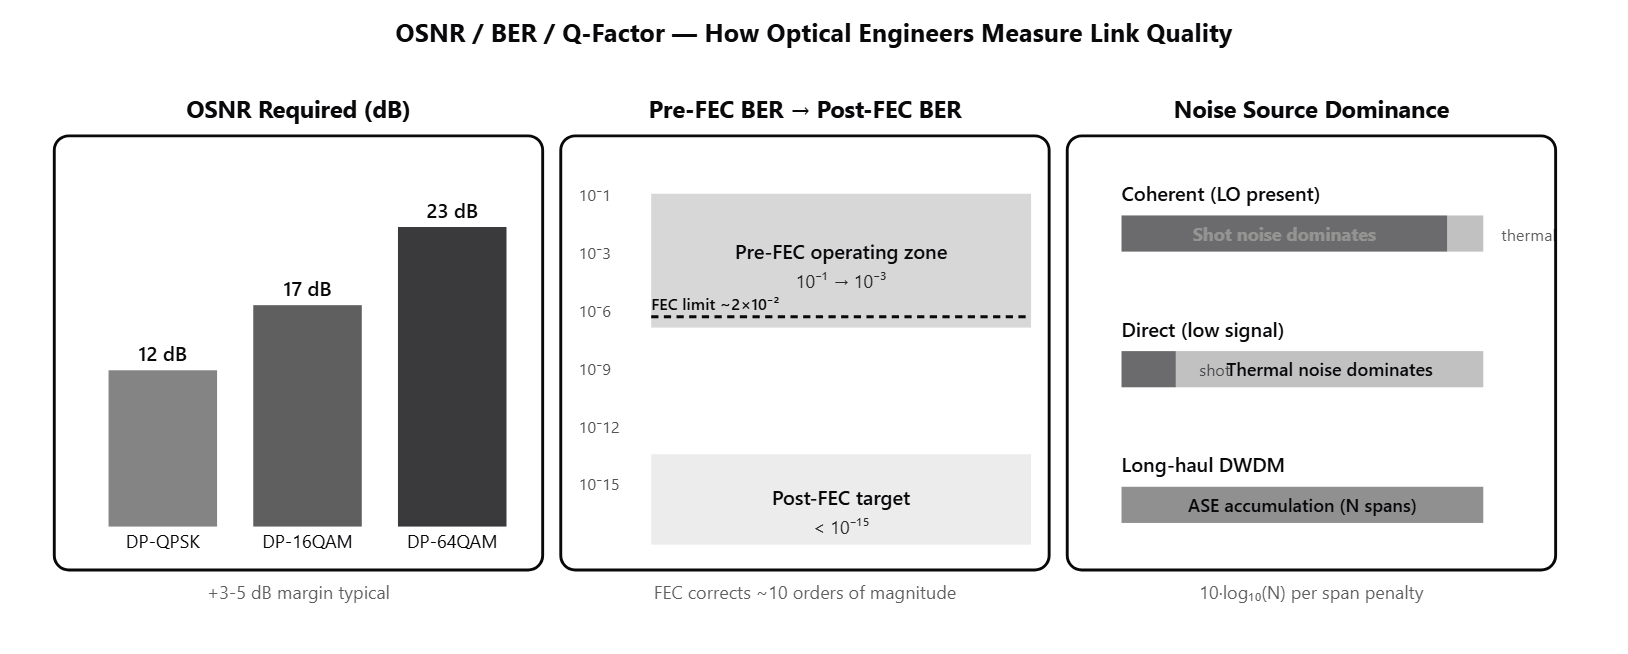
Optical link-quality metrics are the operational language of optical transport. OSNR, BER, Q-factor, and the underlying noise sources together describe how cleanly an optical channel delivers bits across a deployed fiber span, and they are the metrics operators use daily to maintain, troubleshoot, and engineer optical networks. A coherent engineer must navigate all of them: each metric captures a different aspect of link health, and the combination determines whether a channel meets its service-level commitment. OSNR (Optical Signal-to-Noise Ratio) is the dominant link-quality metric in coherent optical transport. Defined as the ratio of signal power to noise power in the standard 0.1 nm reference bandwidth (about 12.5 GHz at 1550 nm), OSNR captures the cumulative effect of amplifier ASE accumulation, fiber-attenuation budget, and any spectrally-localized noise sources. Each coherent modulation format has a specific OSNR threshold below which the FEC cannot correct errors reliably: DP-QPSK around 10-12 dB, DP-16QAM around 15-17 dB, DP-64QAM around 21-24 dB. OSNR margin — the headroom between available OSNR and required OSNR — is the headline number in optical-route engineering, typically sized at 3-5 dB to absorb aging, route-reroute, and nonlinear-penalty uncertainty. BER (Bit Error Rate) splits into pre-FEC and post-FEC metrics. Pre-FEC BER is measured at the input to the FEC decoder — typical coherent transceivers run 10⁻² to 10⁻³ pre-FEC. Post-FEC BER is measured after FEC correction — target is below 10⁻¹⁵ for carrier-grade delivery. The FEC bridges the 10+ orders of magnitude. Operationally, pre-FEC BER is the primary engineering metric because it can be continuously measured (every second of received traffic contains many pre-FEC errors), tracks channel-condition trends, and signals link degradation before any post-FEC errors emerge. Post-FEC BER at 10⁻¹⁵ is too rare to monitor in real time — at 100 Gbps it corresponds to one error every ~28 hours of traffic. The FEC limit is the maximum pre-FEC BER above which the FEC decoder cannot correct all errors reliably. For coherent DP-16QAM with typical soft-decision LDPC FEC at 20% overhead, the limit is around 2×10⁻². Operators set pre-FEC BER alarm thresholds well below the limit (e.g., 5×10⁻³) so they have margin to react before user-visible errors appear. Q-factor is the per-symbol decision-quality metric defined for binary signaling as Q = (μ₁ − μ₀) / (σ₁ + σ₀). For Gaussian noise BER ≈ ½·erfc(Q/√2): Q=6 linear gives BER≈10⁻⁹, Q=7 linear gives BER≈10⁻¹². Q-factor was the headline metric in direct-detection SDH systems — Q=7 dB ≈ 5 linear was the OC-192 benchmark. In modern coherent systems pre-FEC BER and OSNR have largely replaced Q-factor as the operational metrics, but Q still appears in transceiver telemetry as a constellation-cleanliness summary. The underlying noise sources determine what limits OSNR and BER. Shot noise is the quantum noise from discrete photon arrivals, with variance proportional to photocurrent. Thermal noise (Johnson-Nyquist noise) is the electronic-circuit noise from load resistors and amplifier components, with variance independent of signal. In coherent receivers the LO photocurrent is large, so shot noise typically dominates over thermal — coherent reception is shot-noise-limited, which gives it a fundamental sensitivity advantage over direct detection at typical signal powers. Amplifier noise (ASE accumulation across cascaded EDFAs — see /topics/edfa-vs-raman-vs-soa) is the dominant external noise source in long-haul DWDM links, scaling as 10·log10(N) for N amplifier spans. OSNR is measured in deployed systems with optical-spectrum analyzers at tap points (ROADM degrees, receive ends) or — increasingly common in modern systems — inferred by the coherent transceiver itself from receiver-DSP statistics and reported as a "soft" OSNR estimate. Modern operator dashboards display per-channel pre-FEC BER, OSNR, and Q-factor together, and alarm thresholds are tuned per service-class to trigger investigation before user impact emerges.
Why interviewers ask
Optical link-quality metrics are the most-asked operational topic in optical-engineering interviews because they are the daily language of the deployed network. A candidate who fluently navigates OSNR, pre-FEC vs post-FEC BER, Q-factor, the FEC limit, and shot-vs-thermal noise sources is showing the integrated operational understanding that staff optical-transport and senior transceiver-engineer roles require. The pre-FEC vs post-FEC BER distinction is the most diagnostic interview question. Strong candidates explain that pre-FEC is the engineering metric (continuously measurable, trend-visible) and post-FEC is the user-visible delivery quality (target ~10⁻¹⁵, too rare to monitor in real time). They name the FEC limit (~2×10⁻² for typical coherent FEC) and explain that operators set alarm thresholds well below it. Weak candidates collapse the two BERs or claim post-FEC BER is the primary monitored metric. OSNR margin is the route-engineering question. Strong candidates can compute margin = (available OSNR) − (required OSNR) and explain that 3-5 dB margin is typical operator practice to absorb aging, route-reroute (failover paths are longer), and nonlinear-penalty uncertainty. They can describe what happens at 2 dB below threshold (pre-FEC BER rises above FEC limit, post-FEC errors emerge) and the operator-response options (reduce modulation order, increase FEC overhead, use PCS, upgrade fiber, add Raman amplification). Q-factor history is the legacy-vs-modern probe. Strong candidates explain that Q=7 dB ≈ 5 linear was the SDH-era direct-detection benchmark for OC-192 (BER ≈ 10⁻⁷ before FEC), and that modern coherent systems operate at much lower per-symbol Q because soft-decision FEC corrects far more errors. They distinguish Q-factor (per-symbol decision quality) from OSNR (system SNR) without conflating the two. Shot-vs-thermal noise is the architectural-advantage probe. Strong candidates explain that coherent reception is shot-noise-limited because the LO photocurrent is large, while direct detection at low signal power is thermal-noise-limited. This is one of the fundamental sensitivity advantages of coherent reception and one of the reasons coherent has displaced direct detection in long-reach applications. The OSNR measurement question separates operational from theoretical knowledge. Strong candidates know that OSNR is measured with an OSA in deployed systems, or increasingly inferred by the coherent transceiver from its own receiver-DSP statistics. They understand the 0.1 nm reference bandwidth convention and why in-channel noise is challenging to measure on dense channel plans.
Common mistakes
The most common mistake is collapsing pre-FEC and post-FEC BER into one metric. They differ by 10+ orders of magnitude in coherent systems, and the operational role of each is distinct: pre-FEC is the engineering health metric monitored continuously; post-FEC is the user-visible delivery quality measured rarely or inferred. Candidates who say "BER" without specifying which they mean reveal a fundamental gap. A second gap is treating OSNR as an absolute requirement rather than a margin concept. The number that matters is OSNR margin = (available) − (required), with operators sizing 3-5 dB of margin to absorb operational uncertainties. Candidates who quote raw OSNR figures without margin context miss the route-engineering practice. A third gap is confusing Q-factor with OSNR. Q-factor is a per-symbol decision-quality metric (related to BER for binary signaling); OSNR is a system signal-to-noise ratio. They are related but distinct, and the modern coherent metric set has largely moved from Q-factor (legacy direct-detection benchmark) to pre-FEC BER + OSNR (coherent operational metrics). A fourth gap is missing the FEC-limit concept. Each coherent FEC has a specific pre-FEC BER threshold above which it cannot correct errors reliably. Operators tune for "operate well below the FEC limit"; without this concept, candidates cannot explain why the alarm-threshold tuning logic works the way it does. A fifth gap is treating shot noise and thermal noise as interchangeable. In coherent receivers, shot noise dominates because the LO photocurrent is large, making coherent reception shot-noise-limited — a fundamental sensitivity advantage over direct detection at low signal power, which is thermal-noise-limited. Candidates who do not distinguish the noise sources or who claim both dominate equally have not internalized the receiver-sensitivity argument. A sixth gap is missing the practical OSNR-measurement reality. OSNR in deployed systems is measured by OSAs at tap points OR (more commonly in modern systems) inferred by the coherent transceiver from receiver-DSP statistics. The "soft OSNR" estimate is the operator-monitored value on most modern dashboards. Candidates who only describe lab-bench OSNR measurement miss the deployment reality. See /topics/coherent-optical-detection for the receiver-architecture context, /topics/coherent-modulation-formats for the OSNR-vs-modulation trade-off, and /topics/edfa-vs-raman-vs-soa for the amplifier-side noise-cascade physics.
Optical Link-Quality Metrics — Role and Operational Use
| Metric | What it measures | Operational use | Typical range |
|---|---|---|---|
| OSNR | Signal vs noise power in 0.1 nm | Per-channel margin against modulation+FEC requirement | 10-30 dB depending on link length |
| Pre-FEC BER | BER at FEC decoder input | Primary engineering health metric, continuous monitoring | 10⁻¹ to 10⁻⁴ |
| Post-FEC BER | BER after FEC correction | User-visible delivery quality target | < 10⁻¹⁵ typical |
| Q-factor | Per-symbol decision quality | Constellation-cleanliness summary; legacy direct-detection benchmark | 5-15 dB |
| Shot noise | Quantum photon-arrival noise | Dominant noise source in coherent receivers | Linked to LO power |
| Thermal noise | Electronic-circuit thermal noise | Dominant in direct-detection at low signal | Fixed per receiver design |
Sample interview questions
- A coherent receiver reports pre-FEC BER of 2×10⁻³ on a DP-16QAM channel running through 1500 km of G.652 fiber with 18 EDFA spans. The post-FEC BER target is 10⁻¹⁵. Which BER does the operator monitor, and why does the pre-FEC vs post-FEC distinction matter operationally?
- A. Only post-FEC BER matters; pre-FEC is academic.
- B. Operators monitor pre-FEC BER as the primary field-health metric because it changes continuously with channel conditions and can be measured in real time. Post-FEC BER is the user-visible delivery quality but cannot be monitored continuously — at the target rate of 10⁻¹⁵, even high-rate transceivers may see one post-FEC error per hours or days of operation. Pre-FEC BER deviation from baseline (e.g., 2×10⁻³ when baseline was 8×10⁻⁴) signals link degradation long before any post-FEC errors appear, giving operators time to investigate. ✓
- C. Pre-FEC BER and post-FEC BER are identical for coherent systems.
- D. Operators monitor only post-FEC BER because pre-FEC is an internal DSP value.
Option B is correct. Pre-FEC BER (the BER seen at the input to the FEC decoder) is the engineering health metric; post-FEC BER (the BER after FEC correction) is the user-visible delivery quality. The two differ by many orders of magnitude — a coherent transceiver running pre-FEC BER around 10⁻² to 10⁻³ can deliver post-FEC BER below 10⁻¹⁵ if the FEC is strong enough. Why pre-FEC BER is the operational metric: - Continuous measurement: pre-FEC BER updates every few seconds as the FEC decoder counts corrected bit errors per second of data - Trend visibility: a degrading link shows rising pre-FEC BER long before post-FEC errors emerge - Diagnostic value: deviations from per-channel baseline reveal which links are degrading and how fast - Real-time control: operators trigger alarms and route adjustments based on pre-FEC BER thresholds Why post-FEC BER cannot be monitored in real time at 10⁻¹⁵: - At 100 Gbps, 10⁻¹⁵ means one error per 10⁵ seconds of traffic (~28 hours) - At 1.6 Tbps, the per-second BER measurement is below detection - Post-FEC errors arrive in bursts when they do appear, making rate estimation noisy The pre-FEC BER threshold for coherent DP-16QAM with soft-decision LDPC FEC at 20% overhead is typically around 2×10⁻² (the "FEC limit"); below that, the FEC corrects errors; above it, post-FEC errors emerge. Operators set alarm thresholds well below this limit (e.g., 5×10⁻³) so they have margin to react. Option A inverts the operational reality. Option C is wrong — the entire point of FEC is the BER difference. Option D misses that pre-FEC BER is exposed by the coherent transceiver as a standard telemetry value. Production reality: pre-FEC BER monitoring is one of the primary inputs to optical-network health dashboards and is the metric operators tune against when fine-tuning channel power, OSNR margin, and FEC profile per route.
- How does the Q-factor relate to BER for binary signaling, and what does Q ≈ 7 dB (linear ~5) tell you about a coherent optical link?
- A. Q is unrelated to BER; they are independent quality metrics.
- B. For binary signaling Q is the ratio of decision-distance to noise standard deviation: Q = (μ₁ − μ₀) / (σ₁ + σ₀). BER ≈ ½·erfc(Q/√2). Q ≈ 5 (linear) ≈ 17 dB → BER ≈ 3×10⁻⁷. Q = 7 dB ≈ 5 linear is the older direct-detection benchmark for an SDH-era OC-192 system; modern coherent systems operate at much lower per-symbol Q because soft-decision FEC corrects far more errors. Q-factor remains useful as a per-symbol quality summary, but pre-FEC BER and OSNR have largely replaced it as the headline metric. ✓
- C. Q-factor only applies to direct-detection systems, not coherent.
- D. Q-factor is the same as OSNR.
Option B is correct. The Q-factor is defined for binary decision in the standard formulation as Q = (μ₁ − μ₀) / (σ₁ + σ₀), where μ₁ and μ₀ are the mean signal levels for the "1" and "0" decisions and σ₁, σ₀ are the per-symbol noise standard deviations. For Gaussian noise the BER follows BER = ½·erfc(Q/√2). Numerical anchors: - Q = 6 (linear) ≈ 15.6 dB → BER ≈ 10⁻⁹ - Q = 7 (linear) ≈ 16.9 dB → BER ≈ 1.3×10⁻¹² - Q = 7 dB → linear Q ≈ 5 → BER ≈ 3×10⁻⁷ The standard SDH-era direct-detection benchmark was Q = 7 dB ≈ 5 linear, giving BER ~10⁻⁷ before FEC. Modern coherent systems operate at much lower per-symbol Q because: - Coherent operates above the soft-decision FEC limit (pre-FEC BER 10⁻² typical) - The constellation is higher-order (DP-16QAM, DP-64QAM), so the per-symbol Q-formula extension is more complex - FEC pulls the post-FEC BER far below the per-symbol Q would predict Q-factor remains useful in coherent diagnostics as a per-constellation-point cleanliness summary (sometimes called "constellation-Q"), but pre-FEC BER plus OSNR margin have become the headline operational metrics. Many modern coherent transceivers report all three — pre-FEC BER, OSNR, and Q-factor — alongside per-block error counts. Option A misses the analytical relationship. Option C is wrong — Q-factor applies to both direct and coherent reception. Option D is wrong — Q is a per-symbol decision-quality metric, OSNR is a system signal-to-noise ratio; they are related but distinct. Production reality: per-bearer Q-factor still appears in some operator dashboards as a quick health summary; pre-FEC BER is the primary alarm-trigger metric for most modern coherent deployments.
- A coherent DP-16QAM channel needs 16 dB OSNR (in 0.1 nm reference) for reliable operation under its configured FEC. The link OSNR after 12 amplifier spans is calculated as 18 dB. What is the OSNR margin, and what would happen at a route that yielded only 14 dB OSNR?
- A. OSNR margin is 18 dB; the link has plenty of headroom.
- B. OSNR margin is 2 dB (18 dB available minus 16 dB required). A route yielding only 14 dB OSNR would be 2 dB short of requirement — pre-FEC BER would rise above the FEC limit, post-FEC errors would emerge, and the channel would not deliver reliable user data. Operators size routes to maintain 3–5 dB OSNR margin against the modulation-FEC requirement to absorb aging, route reroute (longer paths), and unexpected nonlinear penalties. ✓
- C. OSNR margin is calculated as the difference between the gross and net line rates.
- D. OSNR margin is the same as the FEC overhead percentage.
Option B is correct. OSNR margin = (available OSNR at receive end) − (required OSNR for the modulation+FEC combination). For this example: 18 dB available − 16 dB required = 2 dB margin. Margin sizing in production: - A 0 dB margin means the link is exactly at the FEC limit; any degradation pushes pre-FEC BER above the FEC threshold and produces post-FEC errors - A 3–5 dB margin is typical operator practice — absorbs aging effects (laser drift, EDFA pump degradation), route reroute (failover paths are usually longer with more amplifier spans), seasonal temperature effects on fiber attenuation, and nonlinear-penalty estimation uncertainty - Lower margin is acceptable on short or amplifier-light routes; higher margin is needed on submarine systems where the aging budget compounds over 25-year cable lifetimes A 14 dB OSNR route is 2 dB below the 16 dB requirement. The pre-FEC BER would rise above the FEC-limit threshold (~2×10⁻² for typical coherent FEC at 20% overhead), and the FEC would fail to fully correct the errors. Post-FEC errors would emerge, manifesting as packet losses at the user-data layer. The operator response would be: - Reduce modulation order to DP-QPSK (gains ~6 dB OSNR threshold, easily restoring margin) - Increase FEC overhead (gains ~2-4 dB OSNR threshold) - Use PCS to find a continuous operating point between DP-QPSK and DP-16QAM - If the route requires DP-16QAM for capacity reasons, upgrade the fiber (G.652 → G.654 for nonlinearity reduction), add distributed Raman amplification (improves OSNR by 2-4 dB), or reduce the span count (more amplifiers with shorter spans) Option A confuses absolute OSNR with margin. Option C is unrelated — margin is an SNR concept, not a line-rate one. Option D is wrong — FEC overhead and OSNR margin are different quantities (though they trade against each other). Production reality: OSNR margin is one of the headline numbers in optical-route engineering, sized per-channel-per-route at the planning phase and monitored continuously in operation.
Frequently asked questions
- What is OSNR?
- OSNR (Optical Signal-to-Noise Ratio) is the ratio of optical signal power to optical noise power in a specified bandwidth, expressed in dB. The standard reference bandwidth is 0.1 nm — about 12.5 GHz at 1550 nm — which is the spectral resolution of typical optical-spectrum analyzers. OSNR is the dominant link-quality metric in coherent optical transport: each coherent modulation format has a specific OSNR threshold below which the FEC cannot correct errors reliably. Typical thresholds: DP-QPSK ~10-12 dB, DP-16QAM ~15-17 dB, DP-64QAM ~21-24 dB. OSNR margin is the headroom between available OSNR at the receive end and the required OSNR for the chosen modulation+FEC; operators typically size routes for 3-5 dB OSNR margin.
- What is BER (Bit Error Rate)?
- BER is the fraction of received bits that are received in error, expressed as a probability (e.g., 10⁻⁶ means one error per million bits). Optical engineering distinguishes pre-FEC BER (the BER at the input to the FEC decoder, the field-monitorable engineering metric) from post-FEC BER (the BER after FEC correction, the user-visible delivery quality). The two can differ by 10+ orders of magnitude — coherent transceivers run pre-FEC BER around 10⁻² to 10⁻³ and deliver post-FEC BER below 10⁻¹⁵. Pre-FEC BER is the operational alarm-trigger metric because it can be continuously measured; post-FEC BER at 10⁻¹⁵ is too rare to monitor in real time.
- What is Q-factor?
- Q-factor is a per-symbol decision-quality metric defined for binary signaling as Q = (μ₁ − μ₀) / (σ₁ + σ₀), where μ₁ and μ₀ are mean signal levels and σ₁, σ₀ are per-symbol noise standard deviations. For Gaussian noise BER ≈ ½·erfc(Q/√2). Q = 6 linear gives BER ≈ 10⁻⁹; Q = 7 linear gives BER ≈ 10⁻¹². Q-factor was the headline metric in direct-detection SDH systems where Q = 7 dB ≈ 5 linear was the benchmark for OC-192 operation. Modern coherent systems operate at much lower per-symbol Q because soft-decision FEC corrects far more errors than Q-factor alone would predict; pre-FEC BER and OSNR margin have become the headline coherent metrics, but Q-factor still appears in many transceiver telemetry feeds.
- What is the difference between pre-FEC and post-FEC BER?
- Pre-FEC BER is measured at the input to the FEC decoder — it reflects the raw bit error rate that the channel produces before the FEC correction. Post-FEC BER is measured after FEC correction — it reflects the user-visible delivery quality. The FEC bridges the gap: typical coherent DP-16QAM operates with pre-FEC BER ~10⁻² to 10⁻³ and delivers post-FEC BER < 10⁻¹⁵. Operationally, pre-FEC BER is the engineering health metric because (a) it can be continuously measured (every second of received traffic contains many pre-FEC errors), (b) it tracks channel-condition trends in real time, and (c) deviations from per-channel baseline signal link degradation long before any post-FEC errors emerge. Post-FEC BER at 10⁻¹⁵ is too rare to monitor — at 100 Gbps the rate is one error per ~28 hours of traffic.
- What is the FEC limit?
- The FEC limit is the maximum pre-FEC BER above which the FEC decoder cannot correct all errors reliably. For coherent transceivers with typical soft-decision LDPC FEC at 20% overhead, the FEC limit is around 2×10⁻². Operating below the FEC limit (pre-FEC BER < 2×10⁻²) produces post-FEC BER far below the user requirement; operating above produces post-FEC errors. Operators set pre-FEC BER alarm thresholds well below the FEC limit (e.g., 5×10⁻³) to maintain margin and react before user-visible errors appear. The FEC limit is the operating constraint on every coherent link — it determines whether the chosen modulation+FEC combination works for the available OSNR.
- What is shot noise and how does it compare to thermal noise in an optical receiver?
- Shot noise is the quantum noise from the discrete arrival of photons (or electrons in a photocurrent), with variance proportional to the average photocurrent. Thermal noise (also called Johnson-Nyquist noise) is the thermal-fluctuation noise from the electronic load resistor and amplifier, with variance independent of signal current. In coherent receivers, shot noise typically dominates over thermal noise because the LO photocurrent is large — the LO acts as a built-in pre-amplifier whose shot noise lifts above thermal. This is one of the architectural advantages of coherent reception: the SNR is shot-noise-limited rather than thermal-noise-limited, which gives coherent systems a fundamental sensitivity advantage over direct-detection at typical signal powers. The actual SNR depends on the specific receiver architecture, balanced photodetection, TIA noise figure, and ADC quantization noise.
- How is OSNR measured in deployed systems?
- OSNR is measured by an Optical Spectrum Analyzer (OSA) inserted at a tap point in the link — typically at each ROADM degree and at the receive end of each route. The OSA measures the optical power within the channel bandwidth, then measures the noise power in adjacent bands (the "noise floor" between channels), then computes OSNR = (signal power) / (noise power) normalized to 0.1 nm. For dense channel plans where there is no spectral gap between channels, the in-channel noise must be inferred (challenging — modern coherent transceivers report a "soft" OSNR estimate computed from received-DSP statistics, which is the operator-monitored value). In-fiber Raman test sets and OTDR-style instruments add measurement capability for specific failure-debug scenarios.
- What is the OSNR-reach relationship?
- OSNR at the receive end of a long link follows OSNR_N ≈ OSNR_launch − NF − 10·log10(N) for N equal-loss equal-gain amplifier spans (see /topics/edfa-vs-raman-vs-soa). For each modulation+FEC combination there is a minimum required OSNR; the unregenerated reach is the number of spans for which OSNR_N stays above that threshold (plus operator-required margin). Higher-order modulations need more OSNR → shorter reach. DP-QPSK with strong FEC reaches the longest (thousands of km on standard G.652); DP-16QAM reaches less; DP-64QAM is metro-DCI-only. Operators balance modulation order against the route's amplifier-span count to find the operating point that maximizes capacity per fiber while staying within OSNR-margin requirements.
Related topics
Siblings
- Coherent Optical Detection: How DSPs Replaced Direct Detection
- Coherent Modulation Formats: DP-QPSK, 16QAM, PCS Explained
- EDFA vs Raman vs SOA: Optical Amplifier Comparison
- Optical Fiber Impairments Explained: CD, PMD, Nonlinearity
- DWDM Systems Explained: C-Band, L-Band, and the 400G/800G Era
- Optical Engineer Interview Signals: What Interviewers Probe
Essential AI-Native Skills for OSNR, BER, Q-factor: How Optical Engineers Measure Link Quality
Modern engineering work increasingly uses AI tools for design and code review, debugging, documentation, test and testbench generation, and workflow automation. The goal is not to let AI replace engineering judgment — it is to move faster while keeping verification discipline.
- Use AI to explain unfamiliar code, logs, waveforms, datasheets, or test failures.
- Break large problems into small, reviewable steps you can verify independently.
- Ask AI for hypotheses, then validate them against tests, measurements, simulations, or lab data.
- Version-control your analysis scripts, testbenches, and configs — keep changes small and reviewable.
- Document your assumptions, design tradeoffs, and debugging decisions.
- Verify AI output before trusting it: run the checks that fit the domain — unit tests, linters, simulations, or bench/lab measurements.
- Review AI output for correctness, edge cases, and real-world consequences.
OSNR, BER, Q-factor: How Optical Engineers Measure Link Quality — coming to the question bank
The adaptive practice engine is already live for core wireless, RF, and ML systems. OSNR, BER, Q-factor: How Optical Engineers Measure Link Quality isn't covered in the question bank yet — get notified when it's added.